Outside London, the biggest movers were Leeds - the country's second-fastest rise of 11.3 per cent for an average of £247,116 - and Wolverhampton in fourth place, up 9.5 per cent for an average of £217,837.
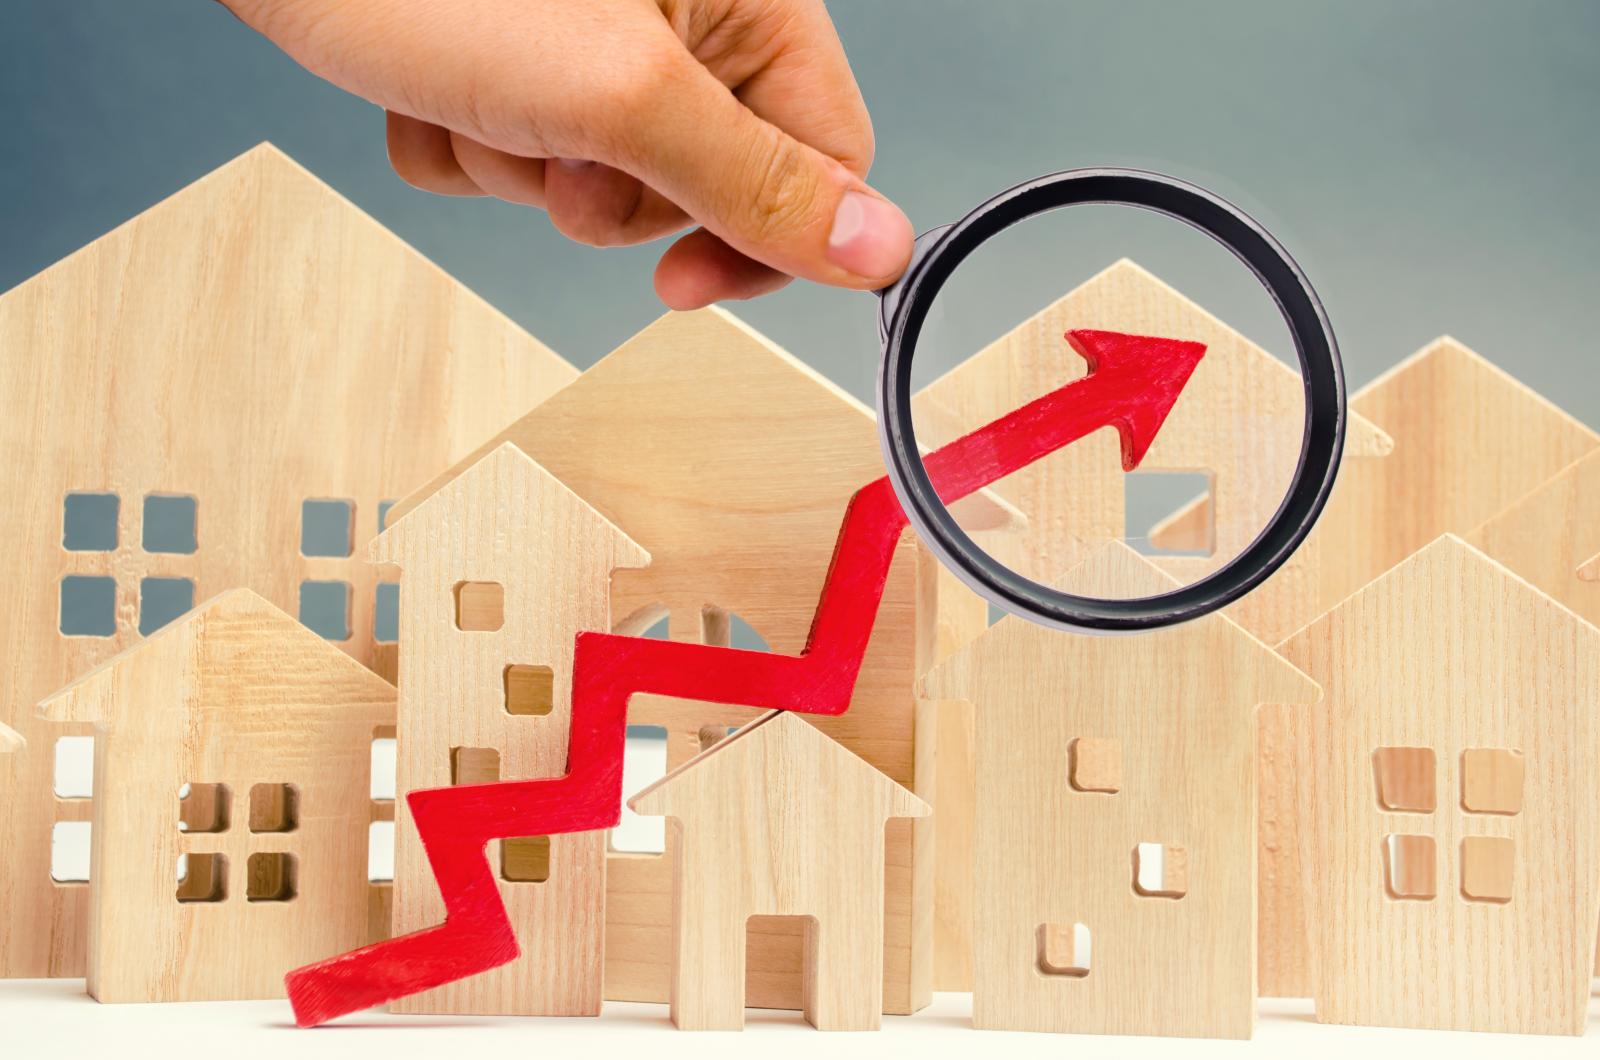
Russell Galley, Halifax managing director, says: "Much like many other things about 2020, it would have been hard to predict which areas would see the greatest movement in average house prices this year.
"For example, depending on the borough, you could be looking at the biggest price rise or the biggest falls in the capital.
"House prices have leapt by more than 11 per cent in Yorkshire's great cosmopolitan city of Leeds and almost 10 per cent in Wolverhampton at the heart of the Black Country.
“Further North, Doncaster and Inverness have also seen healthy growth and whilst the overall house price trend this year has been upward, anyone looking to buy in Paisley, Hackney or Aberdeen will find homes cost a little bit less than last year."
Greater London had nine of the top 20 places for house price rises - Croydon saw a 10.9 per cent rise to £397,538, compared with a rise of just one per cent the previous year.
But pockets of the capital saw price falls - Hackney dropped an average 1.5 per cent.
Top 20 risers:
1. Islington - up 13.4% to £727,922
2. Leeds - 11.3% to £247,115
3. Croydon - 10.9% to £397,538
4. Wolverhampton - 9.5% to £217,837
5. Hounslow - 9.1% to £523,659
6. Doncaster - 8.8% to £176,728
7. Inverness - 8.1% to 195,534
8. Bournemouth - 7.7% to £310,205
9. Watford - 7.7% to £460,102
10. Romford - 7.6% to £391,000
11. Grimsby - 7.5% to £168,035
12. Richmond Upon Thames - 7.5% to £762,749
13. Kingston Upon Thames - 7.4% to £599,317
14. Bolton - 7.1% to £181,853
15. Belfast - 7.1% to 190,486
16. Lambeth - 7% to £618,445
17. Sutton - 6.9% to £468,180
18. Newcastle Upon Tyne - 6.6% to £213,887
19. Hillingdon - 6.3% to £493,671
20. Edinburgh - 6% to £274,246


.png)


.png)


Join the conversation
Be the first to comment (please use the comment box below)
Please login to comment